Maybe you've used Microsoft Excel for years, but have you figured out how to supercharge it? Excel add-ins—software products created to augment Excel's functionality—have been around for decades, but have only recently gained mainstream adoption. Using Microsoft Office add-ins can increase your productivity, assist in analyzing large amounts of data, and help create eye-catching visuals for reports and presentations.
If you're curious about how Office add-ins can boost your productivity within Excel, here are the best Excel add-ins you should try:
ASAP Tools
Free 90-day trial, then $49 one-time
Possibly the most popular add-in for Excel, ASAP Utilities is a set of 300+ tools to combat the tedious little problems we've all experienced when using Excel. If you've ever imported numbers that Excel doesn't recognize and then formats as text, just select those cells and use the ASAP Utilities tool that converts them to numbers. There's a tool to trim empty spaces around cell data, to perform functions on cells based on their background color, to easily transpose one column into multiple columns, to round the numbers in selected cells, and tons more.
Yes, there are other methods of performing most of these tasks, but ASAP Tools has simplified them to a click of your mouse. This simplification will end up saving you hours of time and quite a bit of frustration. ASAP Tools has continuously updated its toolset to tackle the most frequent problems reported by Excel users, so chances are if you come across an Excel issue, ASAP has a tool to make the task easier.
Mapline
free
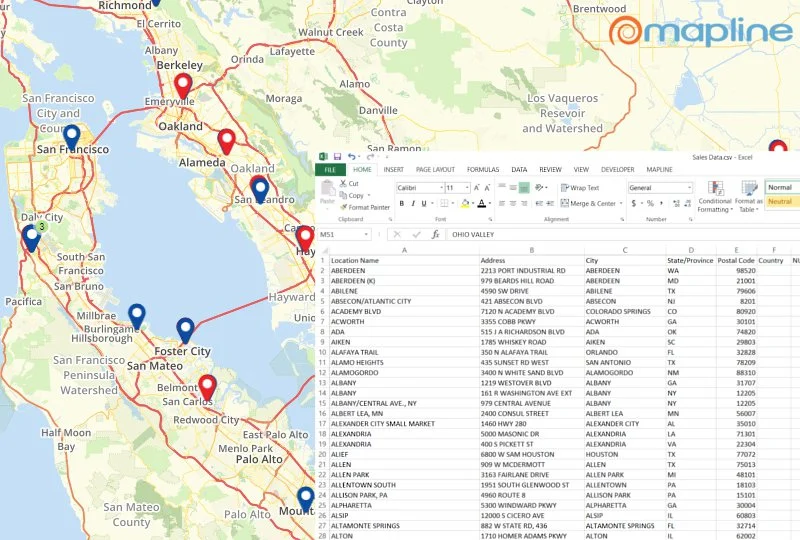
If your company needs to map your clients, customers, or other location-based data, then Mapline is the tool you need. One of the best map add-ins on the market, Mapline allows you to create a map using your excel spreadsheet data with a click of a button. No more bouncing between two different applications to copy and paste data from one to the other.
After using the Excel add-in to create your Mapline map, you then get to the fun part—formatting the map. Use your data to make a heat map to quickly visualize where your hot spots are and where your company can expand. Create color coded sales districts, add labels to customized map pins, include location information bubbles on pins, and when you're done building your map visualization, share it via email, print, or embed it on a website.
Supermetrics for Excel
free 14-day trial, then prices vary by the plan
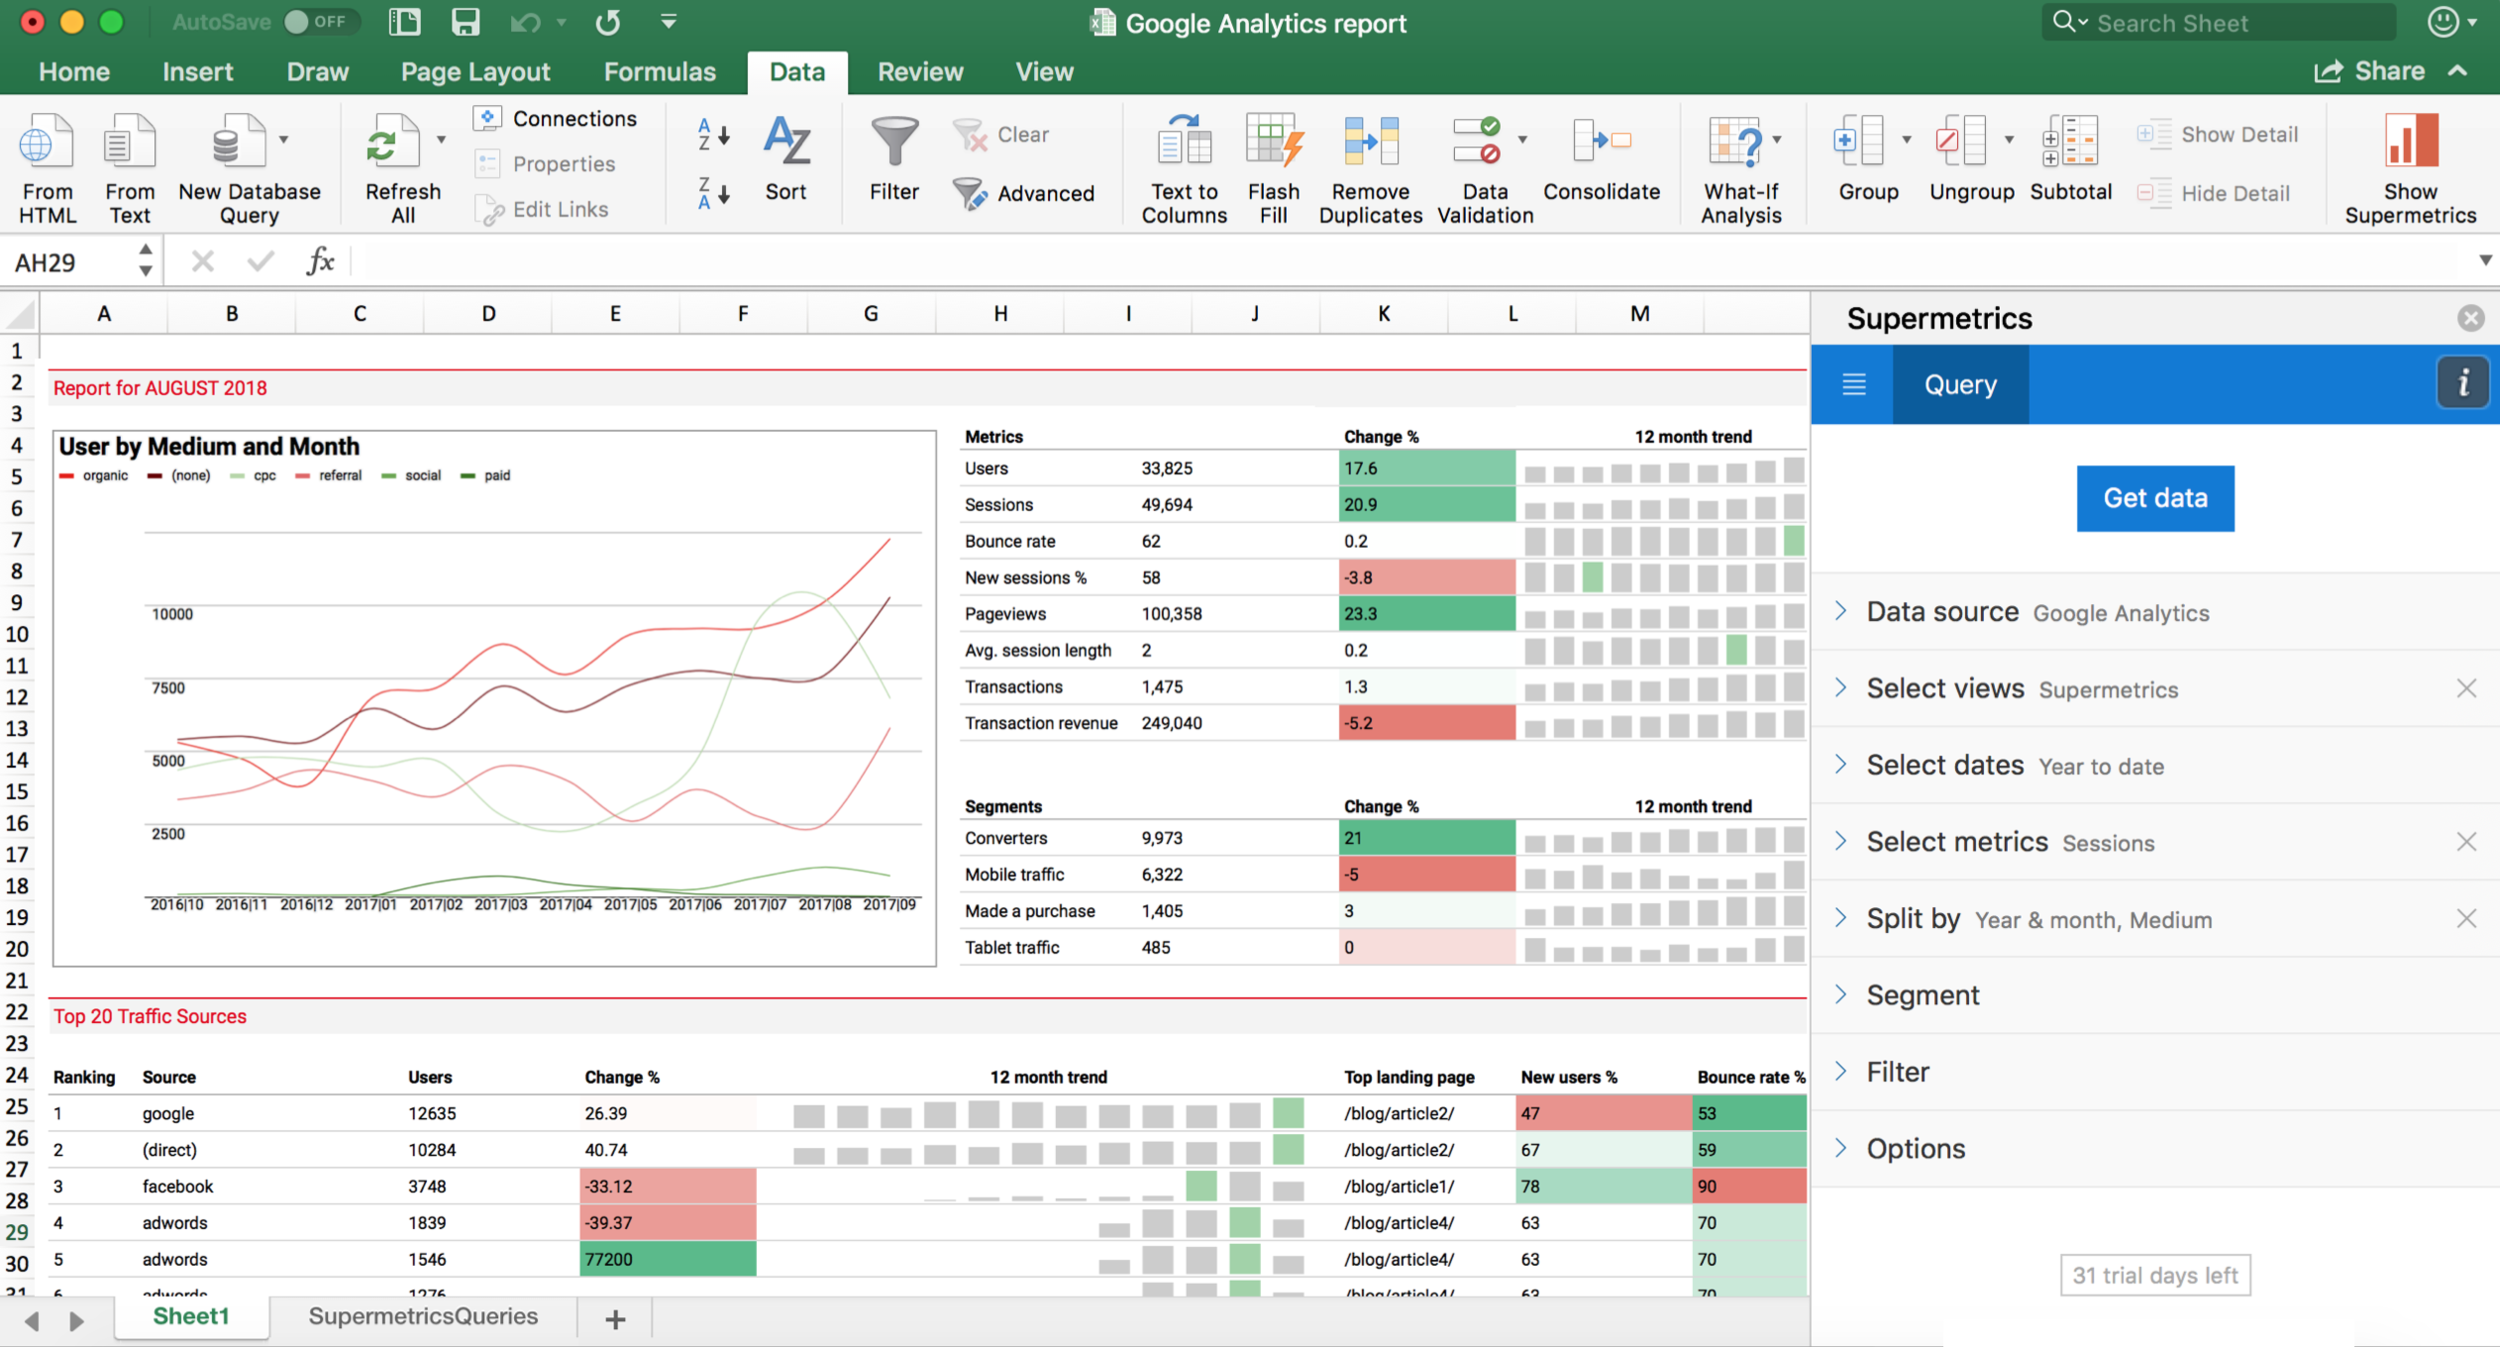
Most companies create reports using data from a variety of sources: Google Analytics, Google Ads, Facebook Ads, Twitter Ads, and many other platforms. It's incredibly time-consuming to gather all the data, then upload spreadsheets and CSV files into Excel for analysis and reporting.
Supermetrics makes the process of pulling data into Excel fast and easy. With the help of an intuitive UI you can get any marketing data you need in a few clicks! You can also automate the entire workflow from data fetching to refreshing dashboards and emailing them.
Cogniview (Windows Only)
FRee (Can only convert 3 pages at once),
full feature set $199 one-time
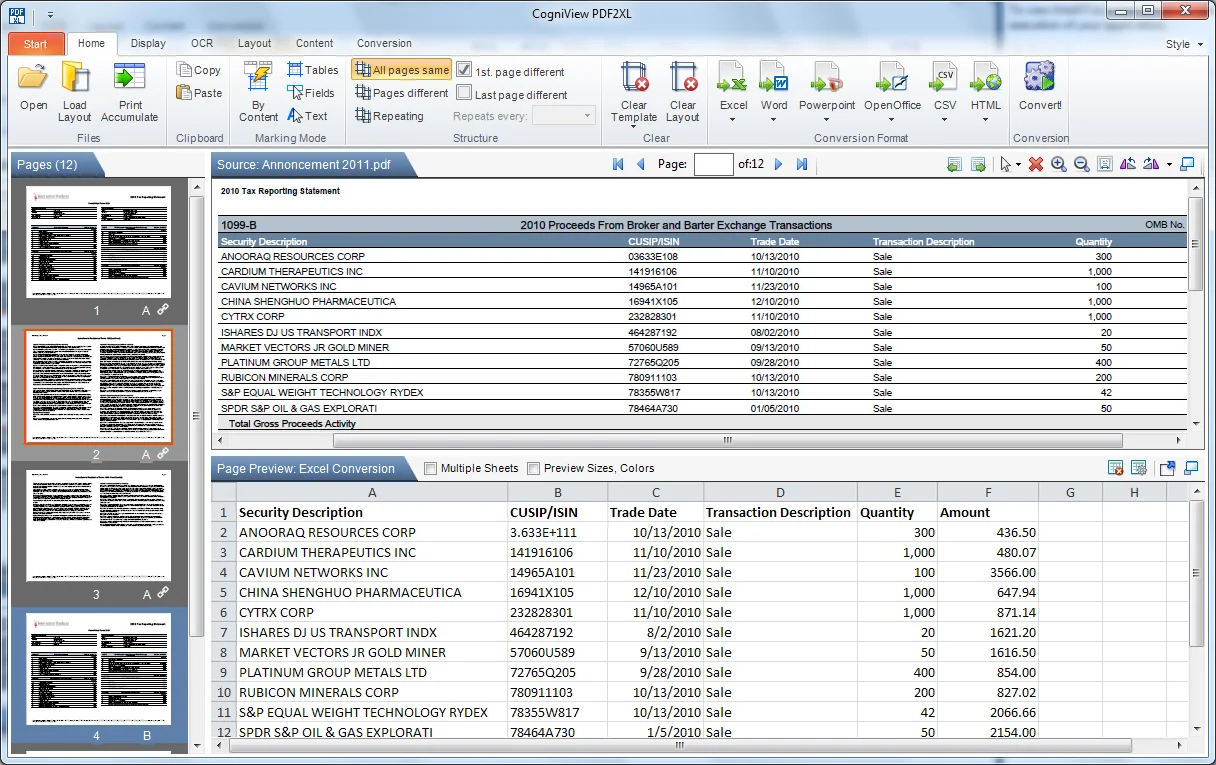
If you've ever been given a PDF or image with data in it and been asked to upload it into Excel, then you know what a slog it can be. Cogniview doesn't want its users to waste time transposing data. Instead, they've created a simple excel add-in to take the pain out of the process.
Using Cogniview, you can covert the data in PDF, JPG, BMP, GIF, and other image files into Excel spreadsheets. The add-in can even do multiple page conversions and batch conversions, so there is no need to load the information page by page. Instead of wasting your time entering the data, you can skip right to analyzing it.
Lucidchart
Free
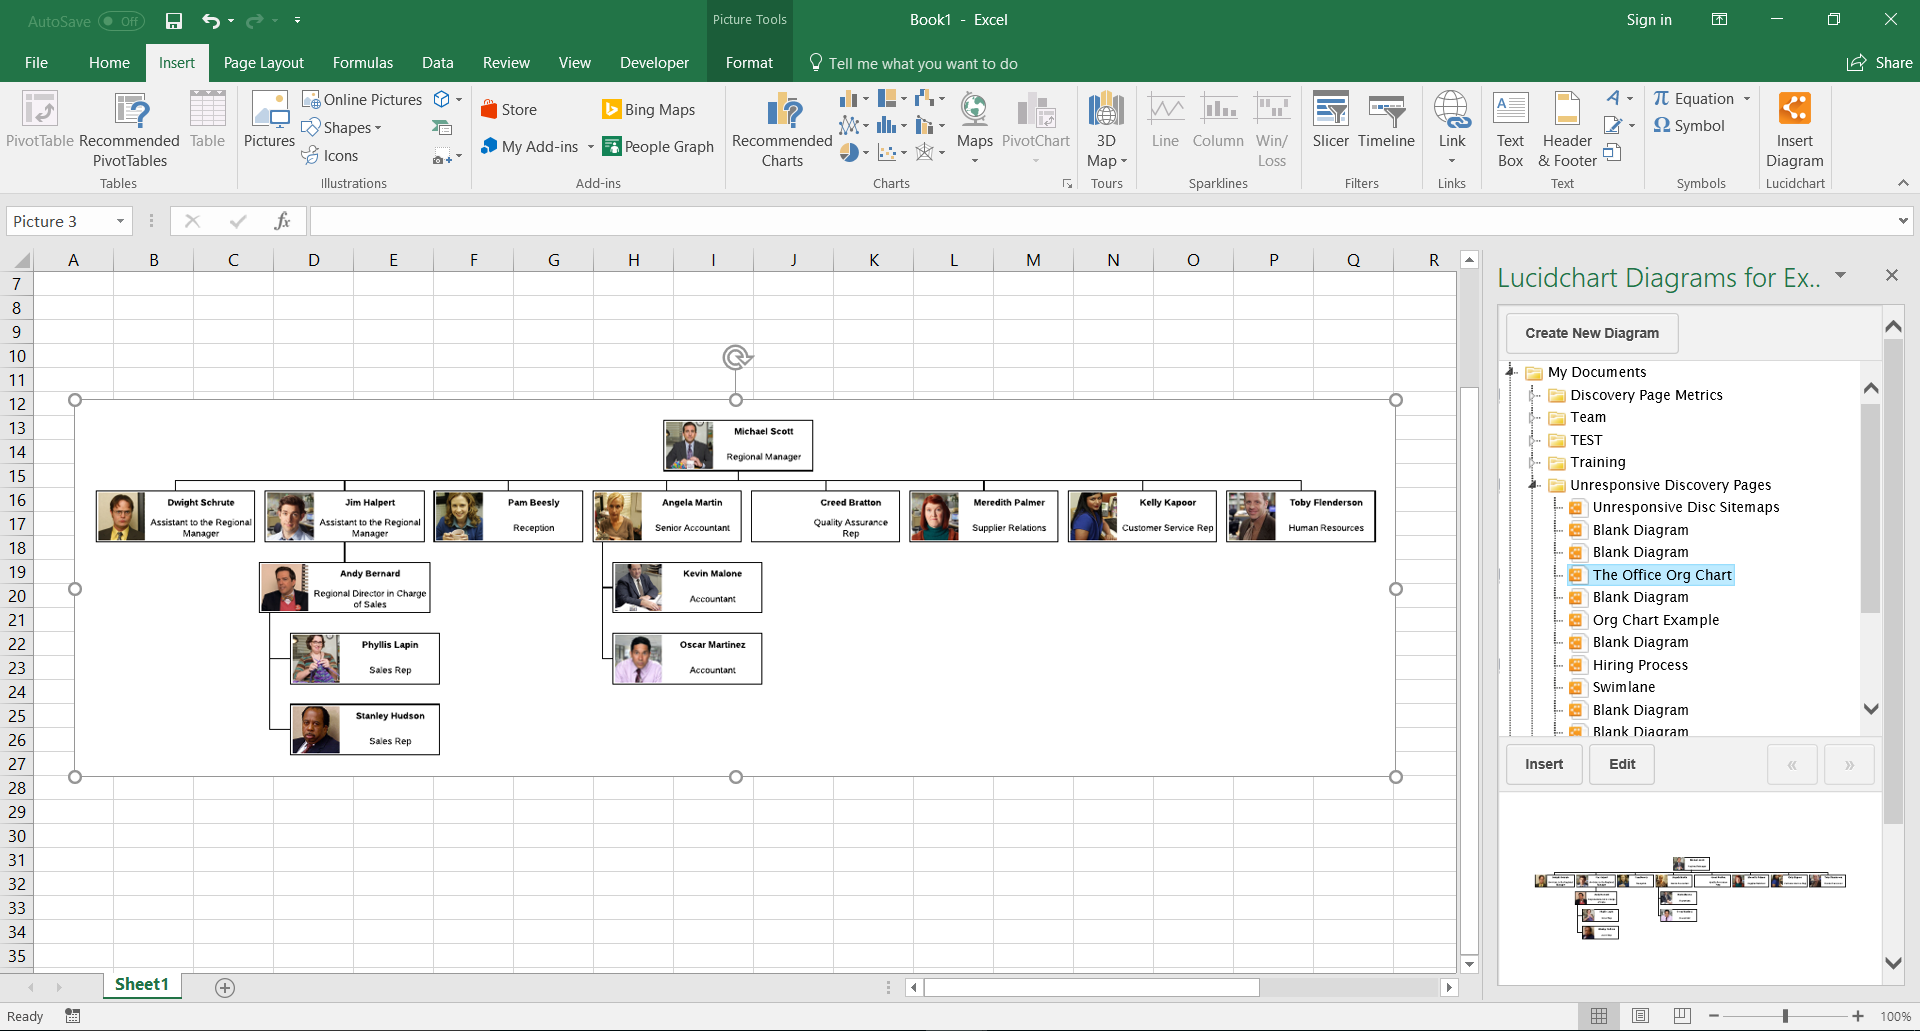
Creating flowcharts in Excel can be frustrating. There aren't many design options, and if your flowchart, diagram, or wireframe is too large, it can cause Excel to malfunction. If you need to include any type of flowchart in your spreadsheet, then Lucidchart is the add-in for you.
Lucidchart allows you to create a variety of chart styles, like IT-style stacked charts, work organization charts, concept maps, and website wireframes. The charts are easily manipulated with a drag and drop interface and come with a variety of design options for the shapes and colors of the boxes and connecting lines.
These Microsoft Excel add-ins are only a few of the many available for Excel. Check out the huge variety of other add-ins on Microsoft AppSource for Excel, Word, PowerPoint, and the rest of the Office suite.
Still don't have Woodpecker? Click the button below and give it a try.


